How E-commerce Dataset look like and what can we do?
an example of analysis and modeling data in E-commerce

NOTE: This blog base on my work. See full code in my repository
Preface
In this blog, we’re given a E-commerce dataset, let’s see what E-commerce dataset look like, what kind of problem we have to face, and how to solve it. For example, In order to define marketing goals, plan spending to lower acquisition costs, we want to know the revenue that customers can bring to our business in their lifetime.
How e-commerce data look like?
In order to read data from database, Python and R are the most popular and powerfull language to handle with huge dataset.
With basic view of dataset, we should notice that:
- Quantity and UnitPrice has min value lower than Zero, this may caused by cancelled orders, discount or sth.
- Invoice and StockCode contain special character, should be a pattern that we have to be cleared.
- There’re anomalies in Quantity and UnitPrice. The min, max values in far away from the standard deviation (compare min, max vs std value). But this might happend in real life, when a customer/enterprise had bulk order.
- There’s some missing values from CustomerID
More details on describing dataset
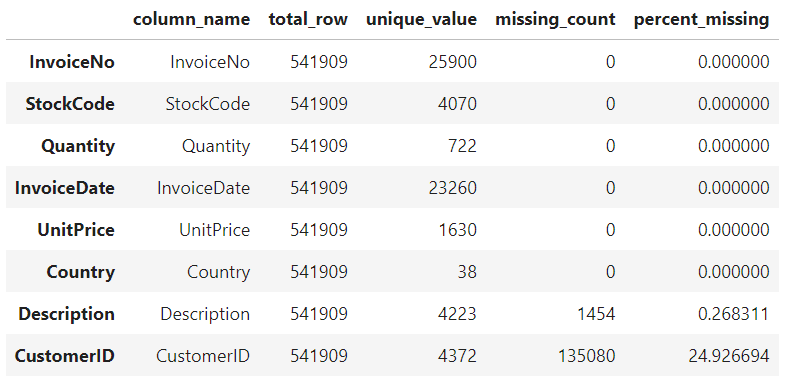
4070 unique StockCode but 4223 unique Description => It might have multiple version of Product name, we should aware working with Product name. 4372 CustomerID = 4372 Customers, compared to 541909 records. But we’re missing 24.9% (135080 records) of customerID.
As 25% is high number, what should we do in this situation?
I got 2 options for missing customerID:
Assume that each row which missing customerID as a new Customer -> assign them as a new CustomerID. In real life, we can use some Data Engineer techiques to acquire missing data in DataWarehouse or DataLake.
- Consider to delete all missing data, because it affects to the buying history of customer if we can’t assign to the right customer, it becomes bad data. Remember: Garbage In, Garbage Out.
- We had 4372 customers and 135080 missing records, it will be weird if we assign 135080 new customers, this will make the data bias and unstable. So we should choose 2nd option with this dataset and this specific problem.
What if there’re cancelled orders?
In cleaning phase, I remove all rows with customerID is Null (mentions above) Then, revome duplicates if any.
In previous section, I mentioned that there’re some pattern relate to special character in StockCode and InvoiceNo, I have hypothesis that InvoiceNo with “C” character is cancel order base on my observation (Quantity and UnitPrice are negative) Then I wrote function that detect strange characters in both StockCode and InvoiceNo:
I proved my hypothesis using code, all of “C” InvoiceNO are negative using python code, so “C” is stand for “Cancelled” Beside, there’re some strange string in StockCode stand alone without number:
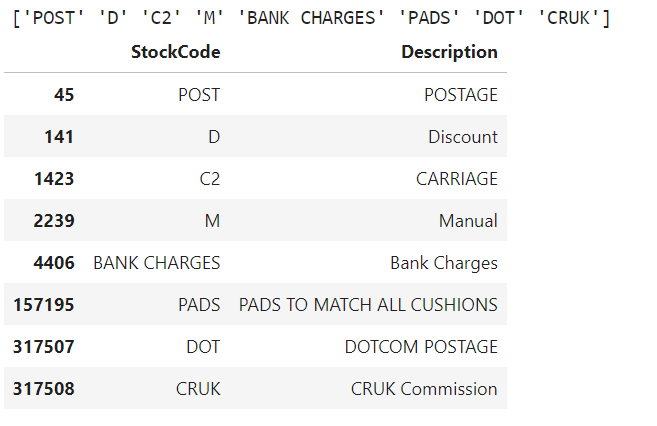
These transactions should represent for some extra Postages/Carriage/Charges from bank/extra pad as present/CRUK commission, some for Discount. I decide to drop all rows as it don’t relate to order & customer behavior, these should belong to business side.
How each customer contributed to the business?
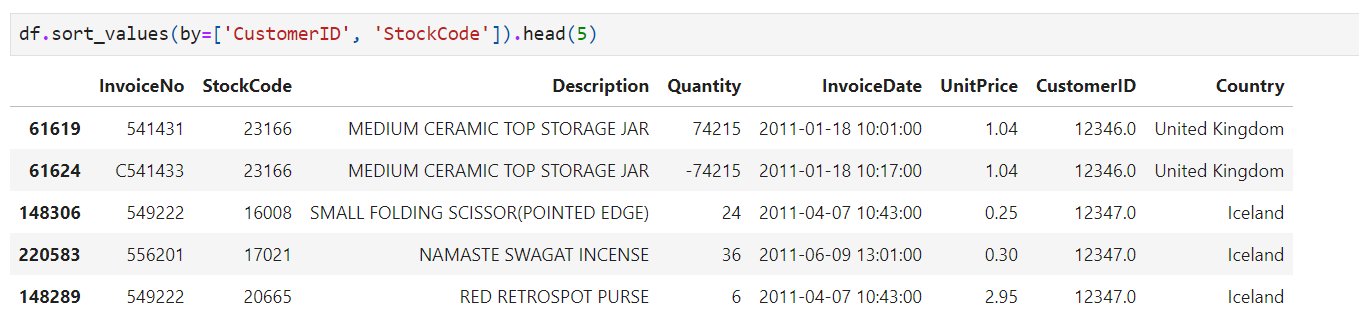
My hypothesis: The InvoiceNo of canceled orders is added ‘C’ character from orginal InvoiceNo Ex: Order invoiceNo 222222, if the customer cancel, the cancel invoiceNo should be C222222 But when checking with Python, my hypothesis is not fullfill. That mean the cancel order will generate Invoice number with ‘C’ character. One possible method is groupby CustomerID and StockCode, which can be aggregated to identify the right quantity and total price of transaction with the business.
We got 2 screnarios:
- Customer cancelled all items of an order
- Customer cancelled part of an order
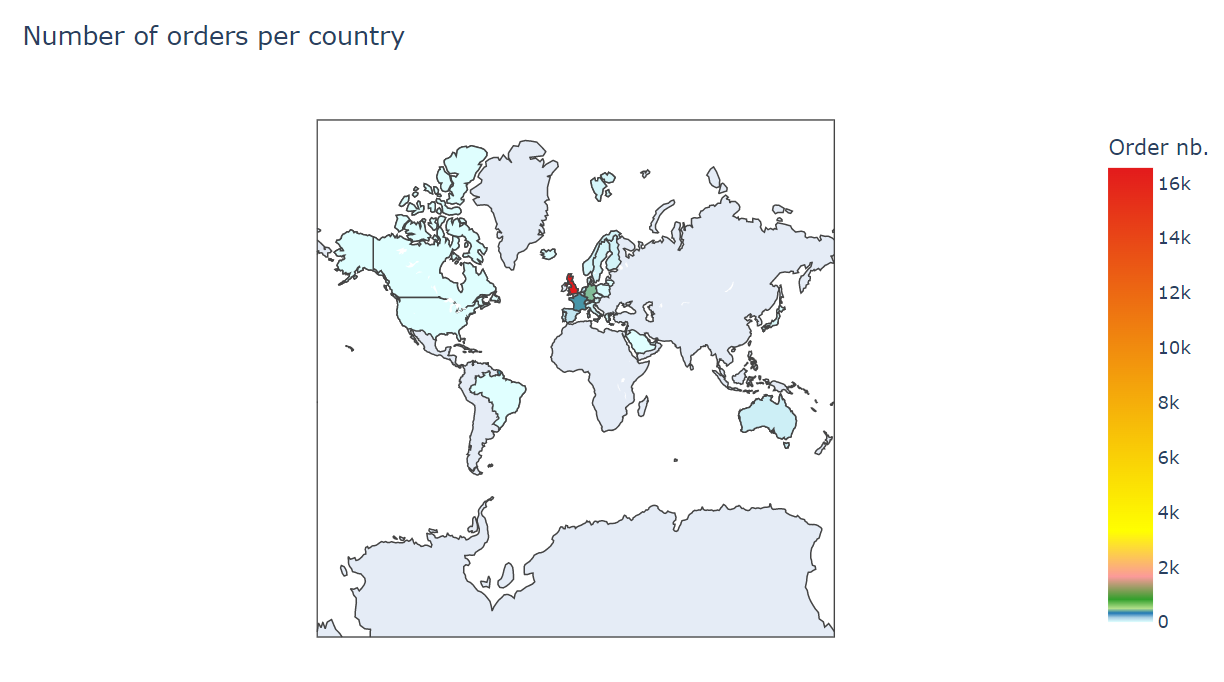
If we group Customer and StockCode, then sum the Quantity & UnitPrice, it should solve that cancelled Products. Thus, I want to plot order groupby country.
In order to plan spending to lower acquisition costs, we want to know the revenue that customers can bring to our business in their lifetime (aka CLV) To answer this question, with the data we got. I have 2 options to solve the problem.
- Customer Segment to define group of customer, deeper analyst to know who they are, so we can pick the right marketing Strategy for them based on Purpose, how to acquire more people like them. With this dataframe, we can use KMean or SVC for customer segmentation, I would use KMean in this post
- For a lifetime value, I recommend a RFM Model to evaluate Recency, Frequency, Monetary Value of each customer. With a new Marketing Goals demand, we can choose the right customer group for.
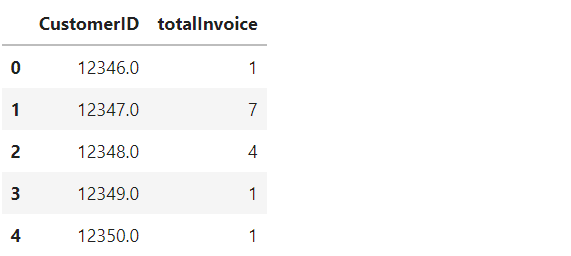
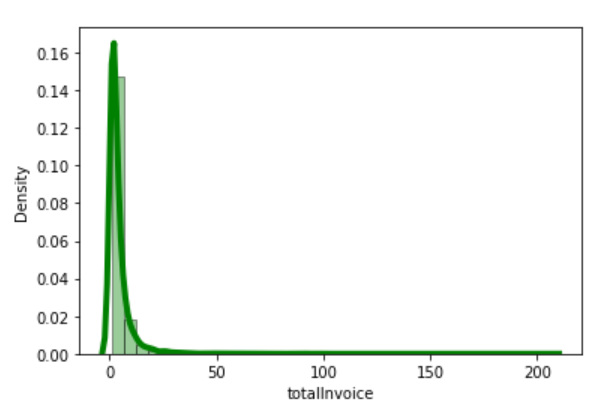
I create new DataFrame that count the number of orders made by each customerID. Then plot the density
Do some featuring, to calculate Recency, Frequency, Monetary, which are
- Recency: How recently a customer has made a purchase
- Frequency: How often a customer makes a purchase
- Monetary Value: How much money a customer spends on purchases I also calculate MostRecent and EngagedAge of each customer base on Earliest and Lastest Invoice.
Can we see the distribution of Customer spending?
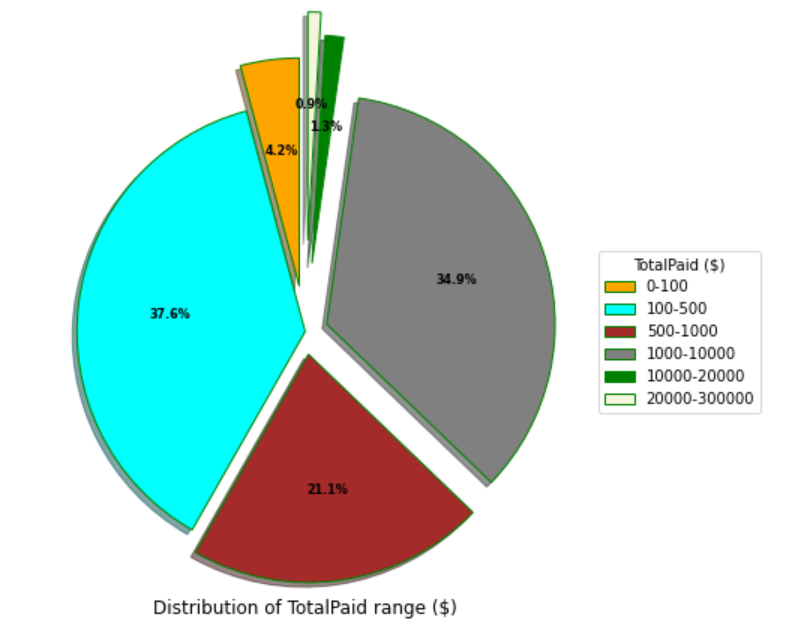
As we can see, 93% of real puchased item is from 100-10000 4.2% go from range 0-100 2.2% customer spent over 20000 The porfolio is quite good.
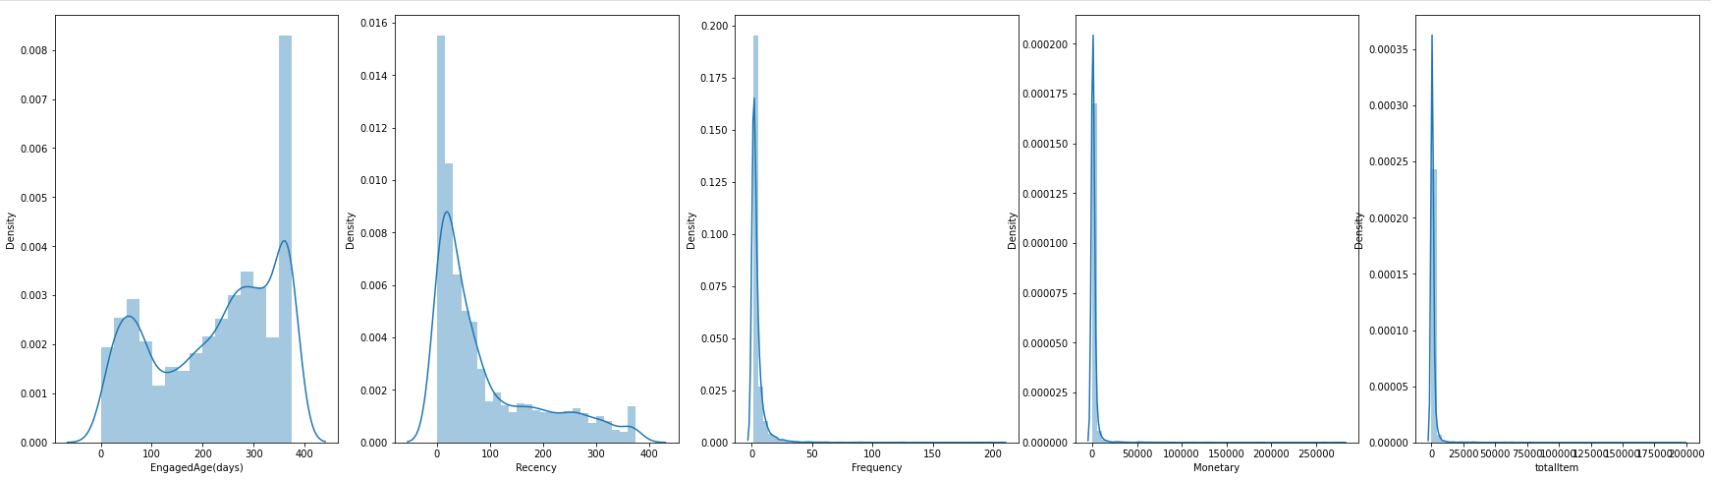
Look at the density plotting figures:
- Data should have one year transaction, and a lot of customers have not bought any items for a long time.
- A high number of customer have not bought frequently.
- There’re some strange orders with high value and number of items so that density is left-skewed, if this blog turn into Risk management, these high values should consider as fraud/anomaly orders.
RFM Calculation, Transform, Scale and put scaled data into KMean. KMean is a unsupervised learning algorithm that segment all customers into small groups. With KMean, I use Elbow Method to optimize number of cluster (k).
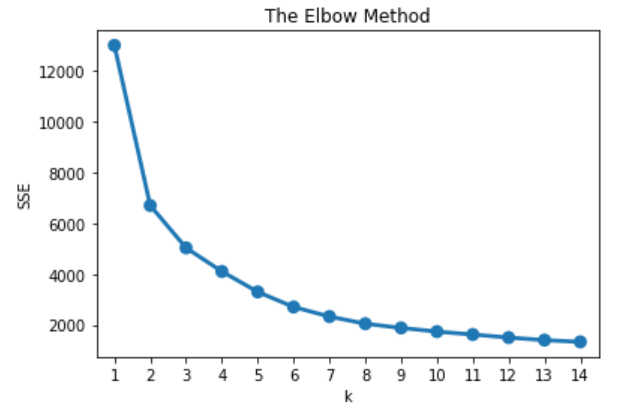
Elbow Method plot dispersion and k into a line graph, and the elbow of the linegraph is where the balance of 2 variables meet. In this graph, I pick 4 is the number of cluster. Run KMean
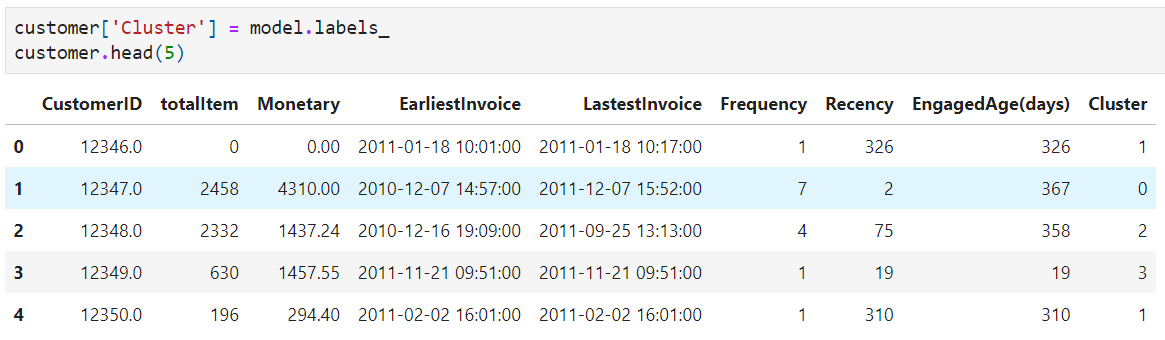
Then, map the clusterred label to the previous dataset.
Groupby Cluster, we can see differences between groups
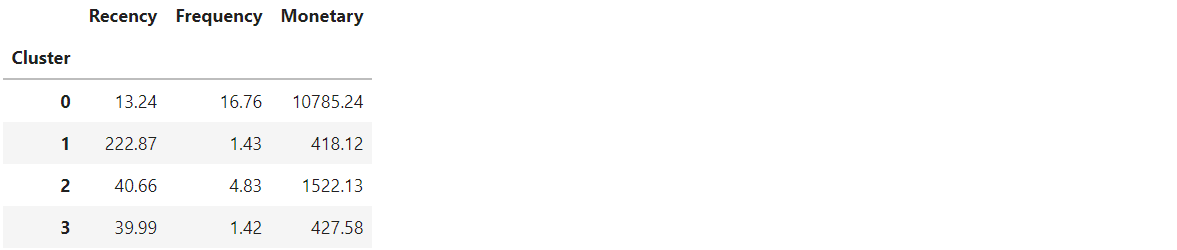
Group 0 : Customers recently buy at high frequency and the amount buying is amazing (average 10000)
Group 1 : Customers shopped for a long time, rarely shop with a decent amount, we shoud try to acquire these customer by trying to figure out why they churned
Group 2 : Customers from last month, regularly and highly purchased.
Group 3 : Customers from last month, rarely and decent amount
Conclusion
This blog just show how to deal with E-commerce dataset, find insights from our customer and show an algorithm that separate customers into segments. Then, we can build customer porfolios of a business to deeper understand our customer, therefore, build a suitable strategies for acquiring new customer with same porfolio, retrieve current customer and build relationship with customer based on each group. For example with group 0 : these customers should have a loyalty program to make them stay with company, invite them us new product or special promotion. Keep track of their value feedback to perfect the product or process.
Further work: With this Dataset, we can build a model that detect factors affectting customer churning or even predict customer churn rate.